Social Media Management Guide: From Consistent Content to Measurable Results
Social media management is not “posting once a day.” Done right, it is an integrated process made up of strategy, content production, a publishing plan, community management and measurement. In this guide, drawing on data from Turkey and around the world, we look at what social media actually adds to your brand, what you should be measuring and which mistakes burn through your budget.
What exactly does social media management cover?
Many businesses think of social media management as “design + posting.” In reality, a social media management operation that delivers sustainable results only works when five distinct disciplines work together.
1. Strategy
First and foremost, you need a clear goal: awareness, demand generation, customer service or recruiting? The strategy layer covers defining your target audience, competitor analysis, brand voice, platform selection and success criteria. Harvard Business Review’s warning still holds: more than 90% of mid-size and large companies have been using social media for over five years in their marketing, yet roughly half of marketers cannot demonstrate the impact of that investment.
“Your company may discover that it needs a strategic do-over.”
— Harvard Business Review
2. Content production
Copy, images, vertical video, short animations, user-generated content and story highlights. Today, content production is predominantly video-driven, and it has to be consistent with the brand’s visual identity. A visual disconnect between your website and your social media accounts is one of the quietest causes of lost trust; that is why your web design and your social media identity need to be fed by the same system.
3. Planning and publishing
Your content calendar has to be in sync with your campaign calendar and your sales calendar. When product launches, seasons, campaign periods and ad investments are not mapped out in advance, social media becomes reactive and scattered.
4. Community management
Comments, direct messages, tags, complaints and brand mentions. For most brands this layer is the weakest link — and it is the layer with the highest measurable return.
5. Reporting
Regular reporting that shows what each piece of content delivered and ties it to business goals. You can’t manage what you don’t measure.

Social media in Turkey by the numbers
Before making any decisions, you need an accurate picture of the market’s size. According to DataReportal’s Digital 2026: Turkey report, Turkey has 77.5 million internet users (88.3% of the population) and 62.3 million social media user identities (70.9% of the population). The population stands at 87.7 million.
The Survey on Information and Communication Technology Usage in Households, published by TÜİK on August 5, 2026, shows that the internet usage rate among 16- to 74-year-olds has risen to 92.3% (94.8% for men, 89.9% for women). The same survey ranks the most-used apps as WhatsApp at 90%, YouTube at 77.6% and Instagram at 71.1%. The share of individuals who bought goods or services online has climbed to 60% — in other words, we are talking about an audience that is ready to turn what it sees on social media into an online purchase.
Advertising reach by platform (DataReportal, Digital 2026: Turkey):
- Instagram: 62.3 million (70.9% of the population)
- YouTube: 57.9 million (66.0%)
- TikTok: 44.9 million users aged 18+ (68.6% of adults aged 18+)
- Facebook: 34.7 million (39.5%)
- LinkedIn: 21.0 million (23.9%)
- X: 18.5 million (21.1%)
Looking at the global picture, the Digital 2026 Global Overview report counts 5.66 billion social media user identities worldwide (68.7% of the world’s population), an average of 2 hours 36 minutes of social media use per day and an average of 6.75 different platforms used per person each month. That last figure is critical: nobody lives on a single platform, so your brand shouldn’t be confined to a single channel either.
Which platforms should your business be on?
The “let’s be everywhere” approach is the most expensive mistake a business with limited resources can make. The right question is: Where does my audience make its decisions? The table below simplifies platform selection by business model.
| Platform | Best suited for | Priority content type | Key metric |
|---|---|---|---|
| B2C, e-commerce, local businesses, service brands | Reels, carousels, Stories, user-generated content | Reach, save and share rate, profile→website clicks | |
| TikTok | Younger audiences, fashion, food, entertainment, new product launches | Short vertical video, trend-driven formats | Completion rate, shares, follower conversion |
| YouTube | Products with long decision cycles, education, both B2B and B2C | Long-form video, product demos, Shorts | Watch time, subscriber growth, search traffic |
| B2B, corporate services, consulting, recruiting | Expert insights, case studies, team and culture content | Qualified reach, website traffic, inbound leads | |
| Local businesses, 35+ audiences, community and group management | Events, announcements, community posts, video | Local reach, number of messages, direction/call clicks | |
| X | News, tech, finance, public-facing customer communication | Short text, real-time announcements, support replies | Response time, brand mention volume and sentiment |
Rule of thumb: For B2C and local businesses, Instagram plus (where it fits) TikTok is a solid starting point. For B2B brands, the LinkedIn + YouTube combination is almost always more efficient than Instagram. For e-commerce brands, Instagram and TikTok do double duty: they fuel product discovery and grow your retargeting pools on the Meta Ads side. If you want to go deeper on advertising, our Meta Ads guide and, for search, our Google Ads campaign management guide are useful companion reads.
Content strategy and content pillars
Content pillars are the 3–5 themes a brand regularly produces content around. Without a pillar structure, your content calendar has to be reinvented from scratch every week, which leads to inconsistency and burnout.
A pillar mix that works for most brands:
- Educational content (30%): Content that solves your audience’s problems and demonstrates expertise.
- Product/service content (25%): Content that explains what you sell, to whom and why.
- Proof content (20%): Customer reviews, case studies, before-and-afters. Nielsen’s research shows that 88% of respondents worldwide trust recommendations from people they know more than any other channel — which is why social proof is non-negotiable.
- Brand and culture content (15%): Team, process, values, behind the scenes.
- Engagement content (10%): Polls, Q&As, community calls to action.
For examples of completed projects, take a look at our work.
Posting frequency: what does the data say?
There is no single right answer to “How many posts per week?”, but there is a data-backed range. According to Rival IQ’s 2025 Social Media Industry Benchmark Report, brands across all industries post an average of 4.5 times per week on Instagram, with a median engagement rate of 0.36%.
Buffer’s analysis of 2.1 million posts from 102,000 accounts shows the link between frequency and performance even more clearly. Compared with accounts posting 1–2 times per week:
- 3–5 posts per week → roughly 12% more reach per post
- 6–9 posts per week → roughly 18% more reach
- 10+ posts per week → roughly 24% more reach
Follower growth moves in the same direction: +0.12% at 1–2 posts per week, +0.26% at 3–5 posts, +0.44% at 6–9 posts and +0.66% at 10+ posts.
A realistic reading: This data doesn’t say “post more” — it says “be consistent.” If you can produce 3 good posts a week instead of 10 weak ones, stick with 3. Frequency gained at the expense of quality also backfires algorithmically, because it drags down your save and share rates.
Organic reach is declining — what does that mean?
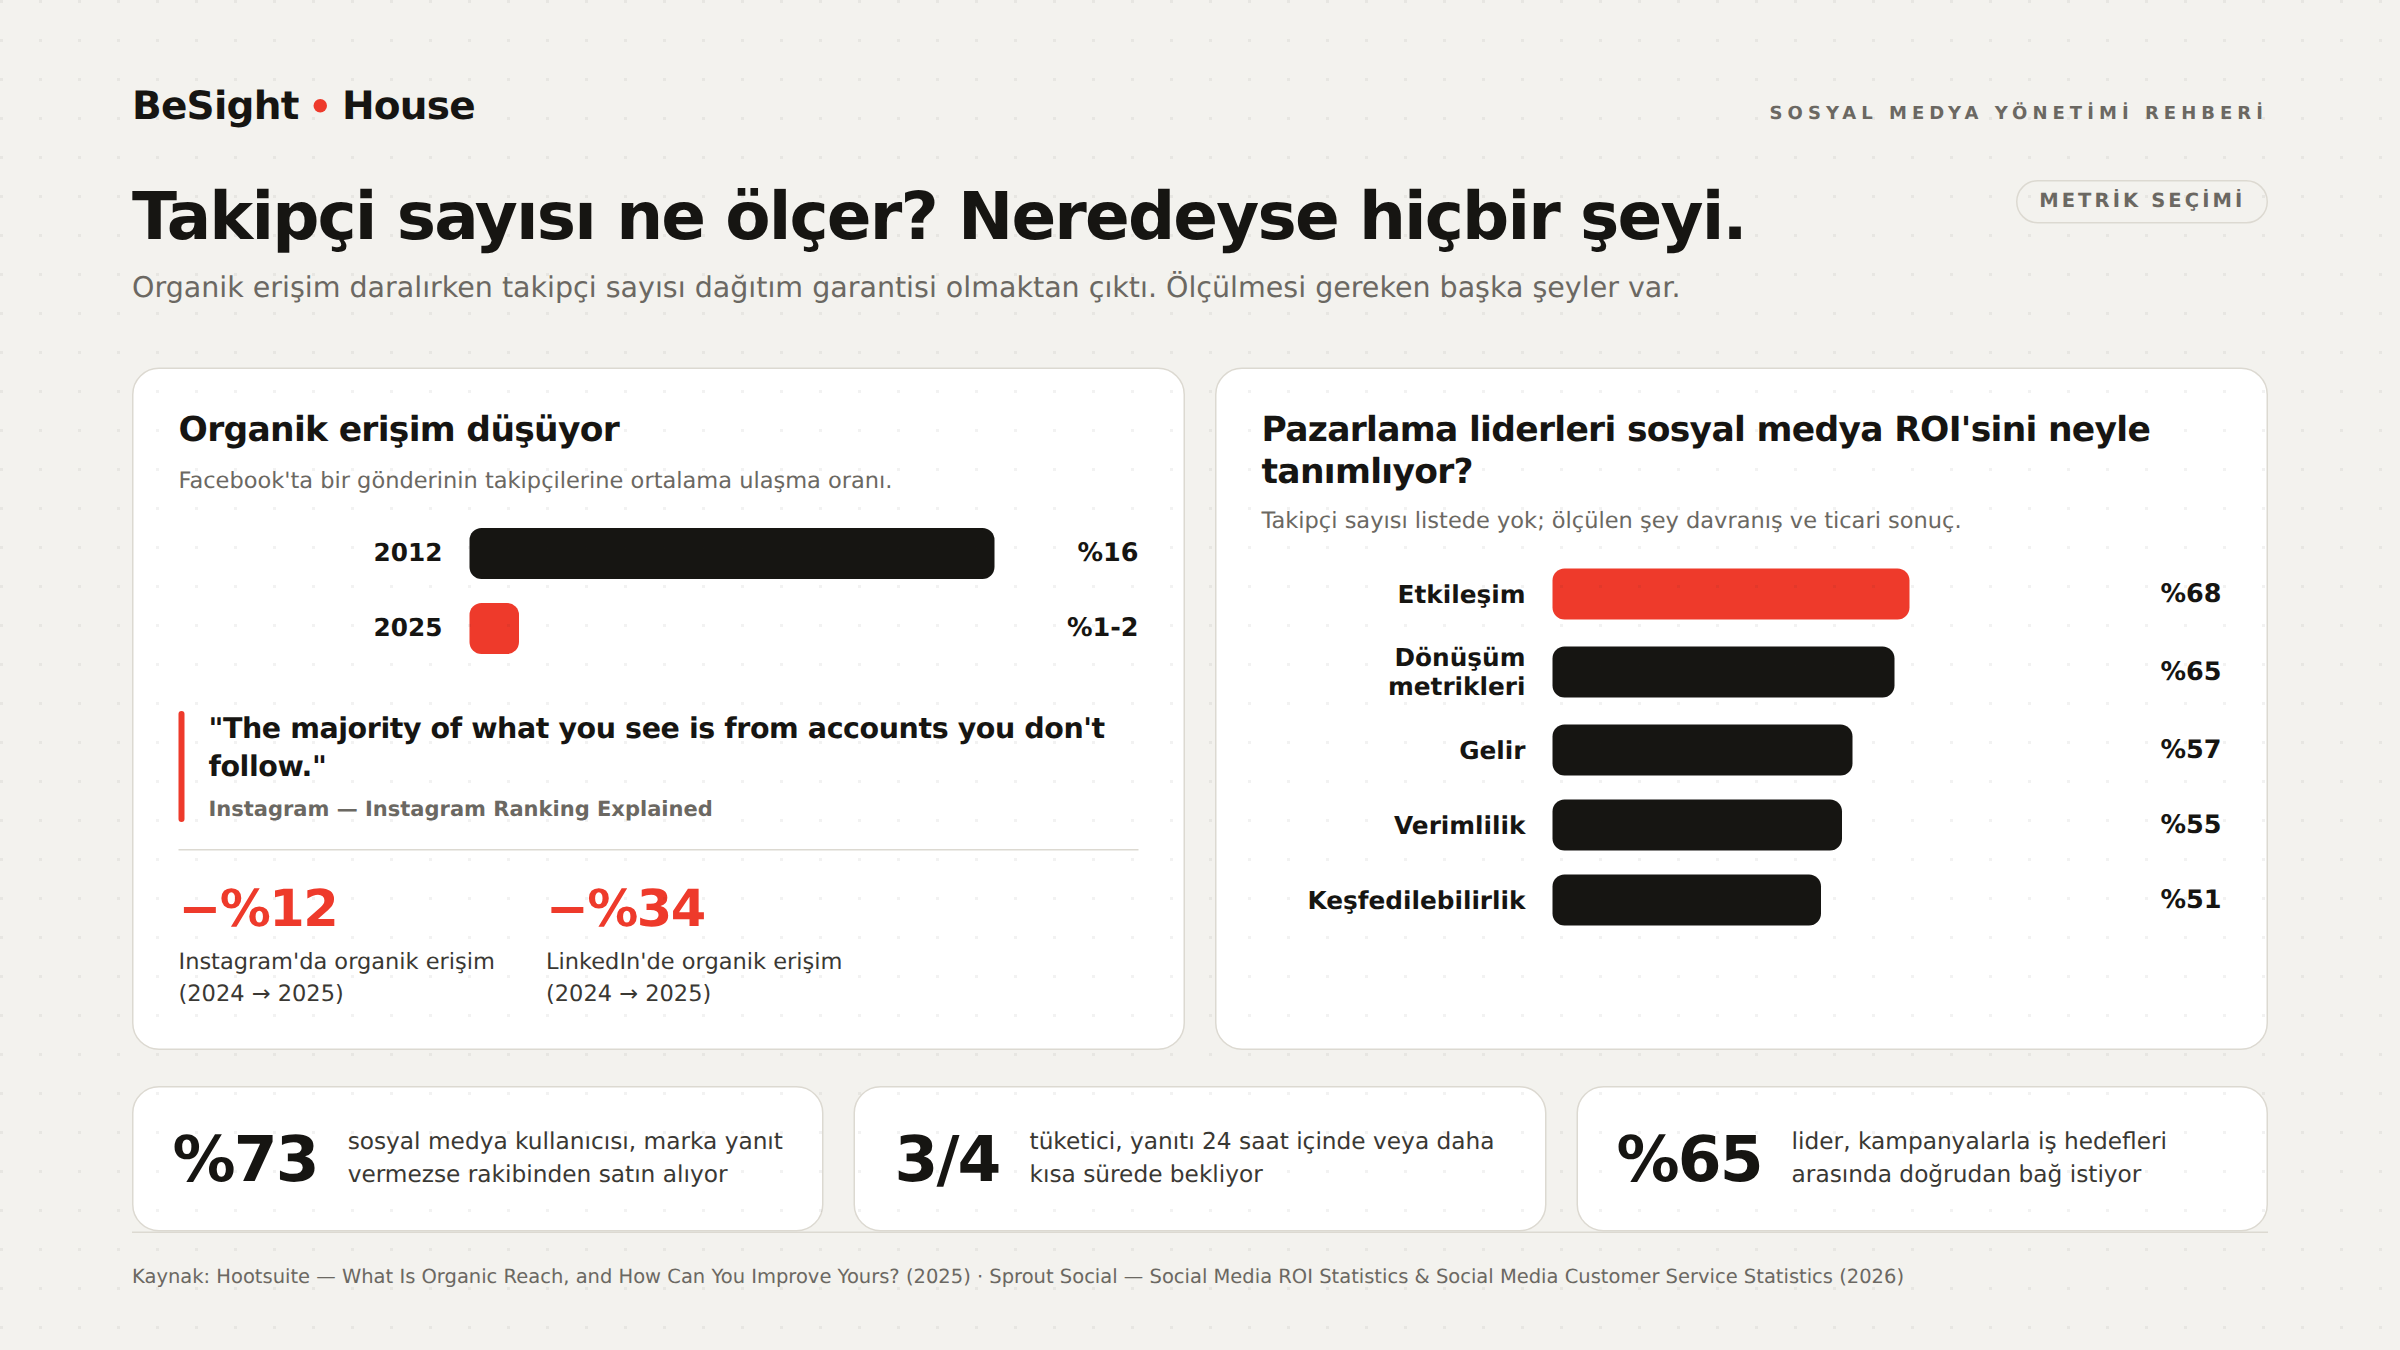
This is the most misunderstood fact about social media. According to data compiled by Hootsuite, average organic reach on Facebook has fallen from 16% in 2012 to the 1–2% range in 2025. On Instagram, organic reach dropped by 12% from 2024 to 2025, and on LinkedIn by 34%.
That doesn’t mean “social media is dead.” What it means is this: your follower count is no longer a guarantee of distribution. Platforms have moved from follow relationships to interest-based recommendations. Instagram says so officially and explicitly:
“The majority of what you see is from accounts you don’t follow.”
— Instagram — Instagram Ranking Explained
For smaller accounts, this is actually an opportunity: good content can be distributed regardless of follower count. But it also means organic reach alone is not enough, and brands that want to scale need to build paid distribution into their strategy.

The weight of video and Reels
According to Instagram’s official explanation, the most important signals in Reels ranking are the reels a user has “liked, saved, reshared, commented on” and signals about the video’s content (audio track, visuals). In other words, the platform rewards content based on how shareable it is.
A Socialinsider study of 15 million posts from 417,130 profiles between October 2025 and March 2026 puts numbers on the format gap:
- Comment rate: Reels 0.06% — carousels 0.04% — images 0.03%
- Share rate: Reels 0.10% — carousels 0.08% — images 0.07%
- Save rate: carousels 0.05% — Reels 0.04% — images 0.02%
The nuance to take away: Reels excel at spread (shares, comments), while carousels excel at saves and depth. The right strategy isn’t “turn everything into Reels”; it is producing reach-focused content as video and reference-worthy content as carousels.
Community management and response time
This is the most neglected layer of social media management, yet the one with the clearest commercial impact. According to Sprout Social data, roughly three in four consumers expect a response within 24 hours or less. Even more striking: 73% of social media users say that if a brand doesn’t respond on social media, they will buy from a competitor.
That turns response time from a matter of “courtesy” into a direct revenue metric. Practical recommendations:
- Set a target response time for business hours (for example, 2 hours) and report on it.
- Prepare approved reply templates for the 20 most frequent questions; a template shouldn’t be copy-and-paste, but a framework for speed.
- Don’t delete negative comments; acknowledge them publicly and move the conversation to private messages. A deleted comment escalates a crisis.
- Add recurring questions from the comments to your calendar as content ideas.
The indirect impact of social media on SEO and branded search
A common question: “Does social media boost SEO?” The straight answer: no, it is not a direct ranking factor. Google representatives have been saying this for years.
“Sorry, we don’t use likes as a ranking factor.”
— John Mueller, Google (Search Engine Journal — Are Social Signals & Shares A Google Ranking Factor?)
But the indirect effect is strong and measurable. A study by Mukherjee and Jansen published in the journal Internet Research finds a causal relationship between conversation volume on social media and web search: for the same brands, it reports that each one-unit increase in social media volume raised Google search volume 4.7-fold on Twitter, 11.9-fold on Instagram and 8.7-fold on Tumblr.
In other words, social media is a demand-generation engine that fuels branded search. People see you on social media, search for your name on Google and land on your website. For this loop to work, your social media has to share the same keyword and messaging universe as your SEO; for the fundamentals, see our guide to what SEO is. How AI-powered search engines see your brand has also become a topic in its own right: on the GEO side, a consistent brand narrative on social media helps models describe you accurately — for details, read our article on GEO and AI search visibility.
Measurement: why is follower count misleading?
Follower count is the most visible yet the weakest social media metric, for three reasons:
- It doesn’t guarantee distribution. In an environment where organic reach has fallen to 1–2%, 50,000 followers doesn’t mean you reach 50,000 people.
- It doesn’t show quality. 2,000 of the right followers generate more revenue than 40,000 irrelevant ones.
- It can be manipulated. Purchased followers distort your ratios and drag down algorithmic performance.
Instead, the metrics you track should be layered and tied to business goals. According to Sprout Social, 68% of marketing leaders use engagement, 65% use conversion metrics, 57% use revenue, 55% use efficiency metrics and 51% use discoverability to define social media ROI. The same source reports that 65% of leaders want a direct link between social media campaigns and business goals.
In practice, this is the core set we recommend tracking:
- Reach and unique accounts reached — are you growing or standing still?
- Save and share rate — the most honest indicator of your content’s real value.
- Profile → website click-through rate — the intent social media pushes to your site.
- Social-referred sessions and conversions (via GA4) — the real commercial proof.
- Average response time and response rate — what customer experience looks like on social.
- Change in branded search volume — the measure of indirect impact.
Agency or in-house team?
This decision depends less on budget than on the number of skill sets you need. Expecting strategy, design, video editing, copywriting, ad management and analytics from a single “social media specialist” role is not realistic.
- In-house has the edge: when deep product knowledge is essential, when content has to be closely tied to day-to-day operations (retail, restaurants, internal culture content), and when several real-time posts go out every day.
- An agency has the edge: when you need multiple disciplines at once, when several platforms and ad channels have to be managed, when you need industry benchmarking and an outside perspective, and when the cost of building a team exceeds a single specialist’s salary.
- Hybrid model: In practice, this is usually the most efficient setup — a content/community lead in-house, with strategy, production and ad management handled externally. For most brands, we set up our social media management service around this hybrid model.
Common mistakes
- Buying followers or engagement. This is the most damaging shortcut in social media today. On November 19, 2018, Instagram announced that it had begun removing fake likes, follows and comments generated through third-party apps; such apps violate its Community Guidelines and Terms of Use. Fake followers mathematically lower your engagement rate (the denominator grows, the numerator doesn’t) and also cause the algorithm to misidentify your audience. The lasting damage outweighs the short-term optics.
- Posting without a goal. Any calendar that starts with “What should we post this week?” runs out of steam within three months.
- Relying on a single platform. When users are active on an average of 6.75 platforms a month, sticking to one channel puts a ceiling on your reach.
- Leaving comments unanswered. 73% of consumers go to a competitor when they don’t get a response.
- Talking only about sales. Accounts that only share promotions, without proof, educational and community content, get unfollowed.
- Running social media disconnected from your website. Sending traffic to a weak landing page wastes all the interest you have generated. For a conversion-focused structure, our corporate web design and conversion guide is a good place to start.
- Looking at metrics once a month. On an account without weekly reviews, the wrong content direction carries on for a whole month.
- Managing organic and paid separately. Your best organic content is your best ad creative; brands that don’t make this connection end up spending their Google Ads and Meta budgets on testing.
Frequently asked questions
How long does social media management take to show results?
Engagement and reach signals usually become readable within 4–8 weeks; seeing a meaningful trend in brand awareness and social-driven conversions takes 3–6 months of consistent production. With organic reach shrinking, accounts that combine regular publishing with paid distribution shorten this timeline.
How many times a week should I post?
According to Rival IQ data, brands post an average of 4.5 times per week on Instagram. Buffer’s analysis of 2.1 million posts shows that 3–5 posts per week deliver roughly 12% more reach per post than 1–2 posts. Stick to the highest frequency at which you can maintain quality.
Is buying followers harmful?
Yes. Third-party apps that generate fake engagement violate Instagram’s Community Guidelines and Terms of Use, and the platform removes that engagement. Fake followers also lower your engagement rate, which leads the algorithm to distribute your content less. Short-term optics are not worth the long-term loss of reach.
Should a B2B company be on Instagram?
Not necessarily. In Turkey, LinkedIn reaches 21.0 million people (23.9% of the population) and is more efficient for B2B when it comes to reaching decision-makers. In B2B, Instagram usually makes sense as a secondary channel for employer branding and company culture content — not as the main demand channel.
Does social media help SEO?
It is not a direct ranking factor; Google representatives have repeatedly stated that likes and shares are not used in rankings. But its indirect effect is strong: academic research shows that conversation volume on social media significantly increases branded search volume. Social media creates demand; SEO captures it.
Do Reels or carousels perform better?
It depends on the goal. In Socialinsider’s analysis of 15 million posts, Reels lead on share rate (0.10%) and comment rate (0.06%), while carousels beat Reels on save rate (0.05% vs. 0.04%). Use Reels to reach new audiences and carousels to create reference value for your existing audience.
Sources
- DataReportal (We Are Social & Meltwater) — Digital 2026: Turkey
- DataReportal — Digital 2026: Global Overview Report
- TÜİK (Turkish Statistical Institute) — Survey on Information and Communication Technology (ICT) Usage in Households, 2026
- Sprout Social — Social Media Customer Service Statistics
- Sprout Social — Social Media ROI Statistics Marketers Need to Know
- Sprout Social — The Social Media Metrics to Track
- Hootsuite — What Is Organic Reach, and How Can You Improve Yours?
- Buffer — How Often Should You Post on Instagram? (2 Million Posts Analyzed)
- Rival IQ — What Is a Good Engagement Rate on Instagram?
- Socialinsider — Instagram Engagement Report
- Instagram — Instagram Ranking Explained
- Harvard Business Review — The Basic Social Media Mistakes Companies Still Make
- Nielsen — Beyond Martech: Building Trust With Consumers
- Search Engine Journal — Are Social Signals & Shares A Google Ranking Factor?
- Mukherjee & Jansen, Internet Research (2017) — Conversing and Searching: The Causal Relationship Between Social Media and Web Search
- Marketing Dive — Instagram Clamps Down on Fake Followers, ‘Inauthentic Activity’
If you want to run your brand’s social media on data rather than guesswork, let us review your current accounts, content structure and competitors and build a roadmap tailored to you. Get in touch and the BeSight House team will carry out the initial assessment together with you.